5 Useful Google Analytics Standard Reports To Check Out For Your Website
You can do a lot to improve the performance and user experience across your site by making use of your Google Analytics account. In this post, we'll cover five valuable standard reports that you can view for your site right now.
The "Audience" report
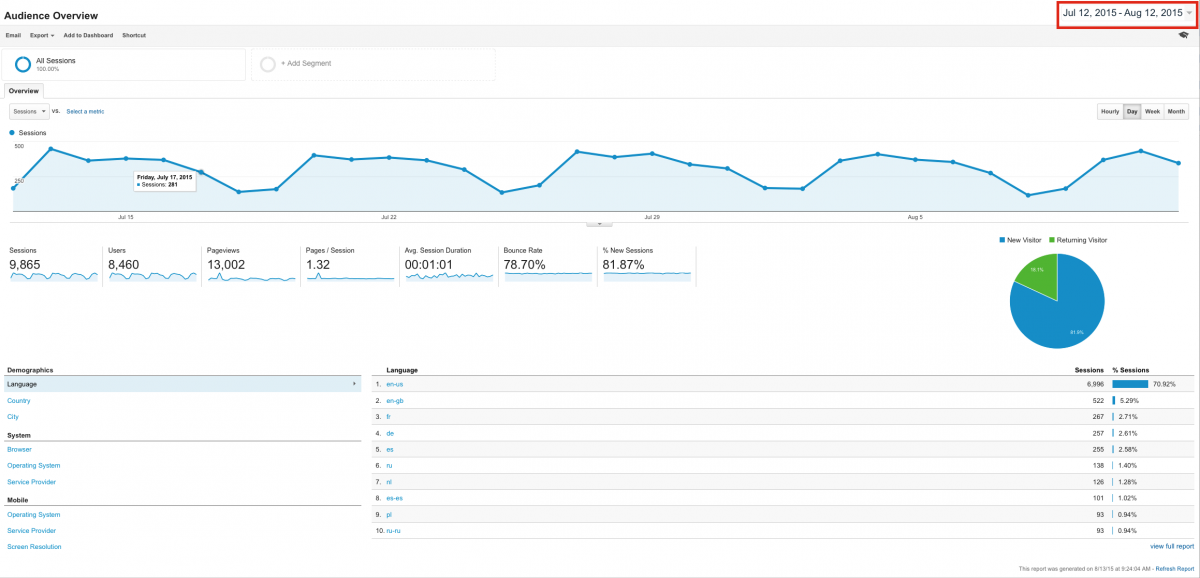
The audience report is one of the most, if not the most, useful reports that you can view for your site. Based on a selected period of time, this report shows the total number of sessions, users, and page views, as well as other valuable information such as the average session duration and the bounce rate percentage.
Demographic, system, and mobile statistics also can be viewed on the same dashboard as the aforementioned numbers. This allows you to see what county and city your site visitors are coming from, what browser and operating system they’re using, as well as what type of mobile device and screen resolution they’re viewing your site on.
How to access the report
- Log in to your Google Analytics account.
- Click the Reporting tab (if you have more than one site linked with your account, be sure that you’ve selected the site you want to view reports for).
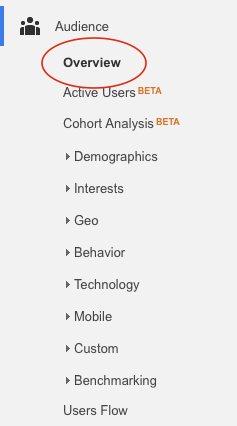
- Click Overview from the Audience menu item on the left-hand side of the page.
4. Select the dates for which you wish to view data from the calendar in the upper right-hand corner.
The "Acquisition" report
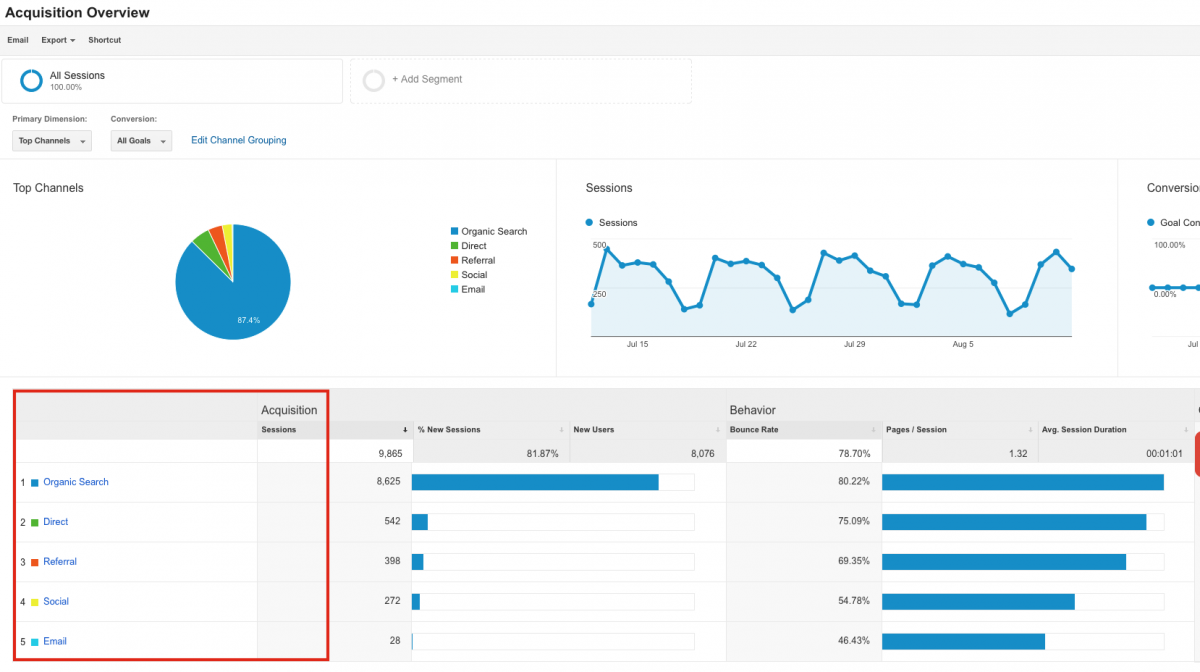
The acquisition report allows you to view how users are getting to your site. For example, you can see the number of users who arrived on your site via organic search, via direct navigation, or via other avenues such as email.
Additionally, each avenue allows you to drill down further for more in-depth information. You can view the keywords users have searched for on search engines that led them to your site, the direct URL they entered, as well as which social network they clicked a link to your site from.
How to access the report
- Log in to your Google Analytics account.
- Click the Reporting tab (if you have more than one site linked with your account, be sure that you’ve selected the site you want to view reports for).
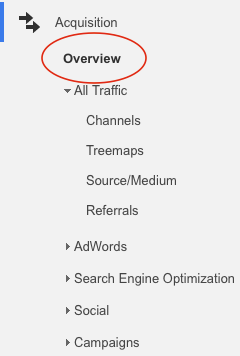
- Click Overview from the Acquisition menu item on the left-hand side of the page.
4. To drill down even further, click on the item you wish to explore in more depth from the Acquisition column on the lower portion of the page.
The "Site Content" report
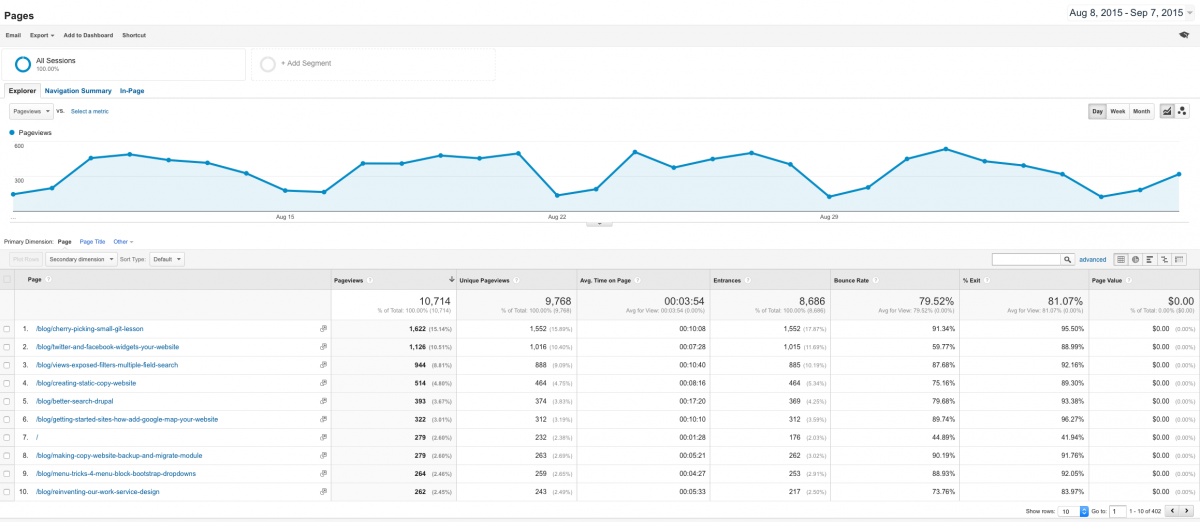
The site content report is another handy report, as it shows you which pages are the most visited on your site. You can view the total number of page views for a specific page, as well as other useful stats such as the average amount of time a user spends on a given page.
This report can be incredibly helpful when “cleaning up” your site content, as it aids in painting a picture of what visitors are looking for most on your site.
How to access the report
- Log in to your Google Analytics account.
- Click the Reporting tab (if you have more than one site linked with your account, be sure that you’ve selected the site you want to view reports for).
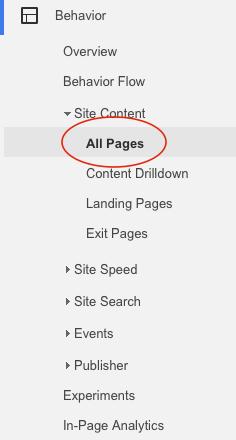
- Click All Pages from the Site Content menu item under the Behavior menu item on the left-hand side of the page.
The "Real-Time" report
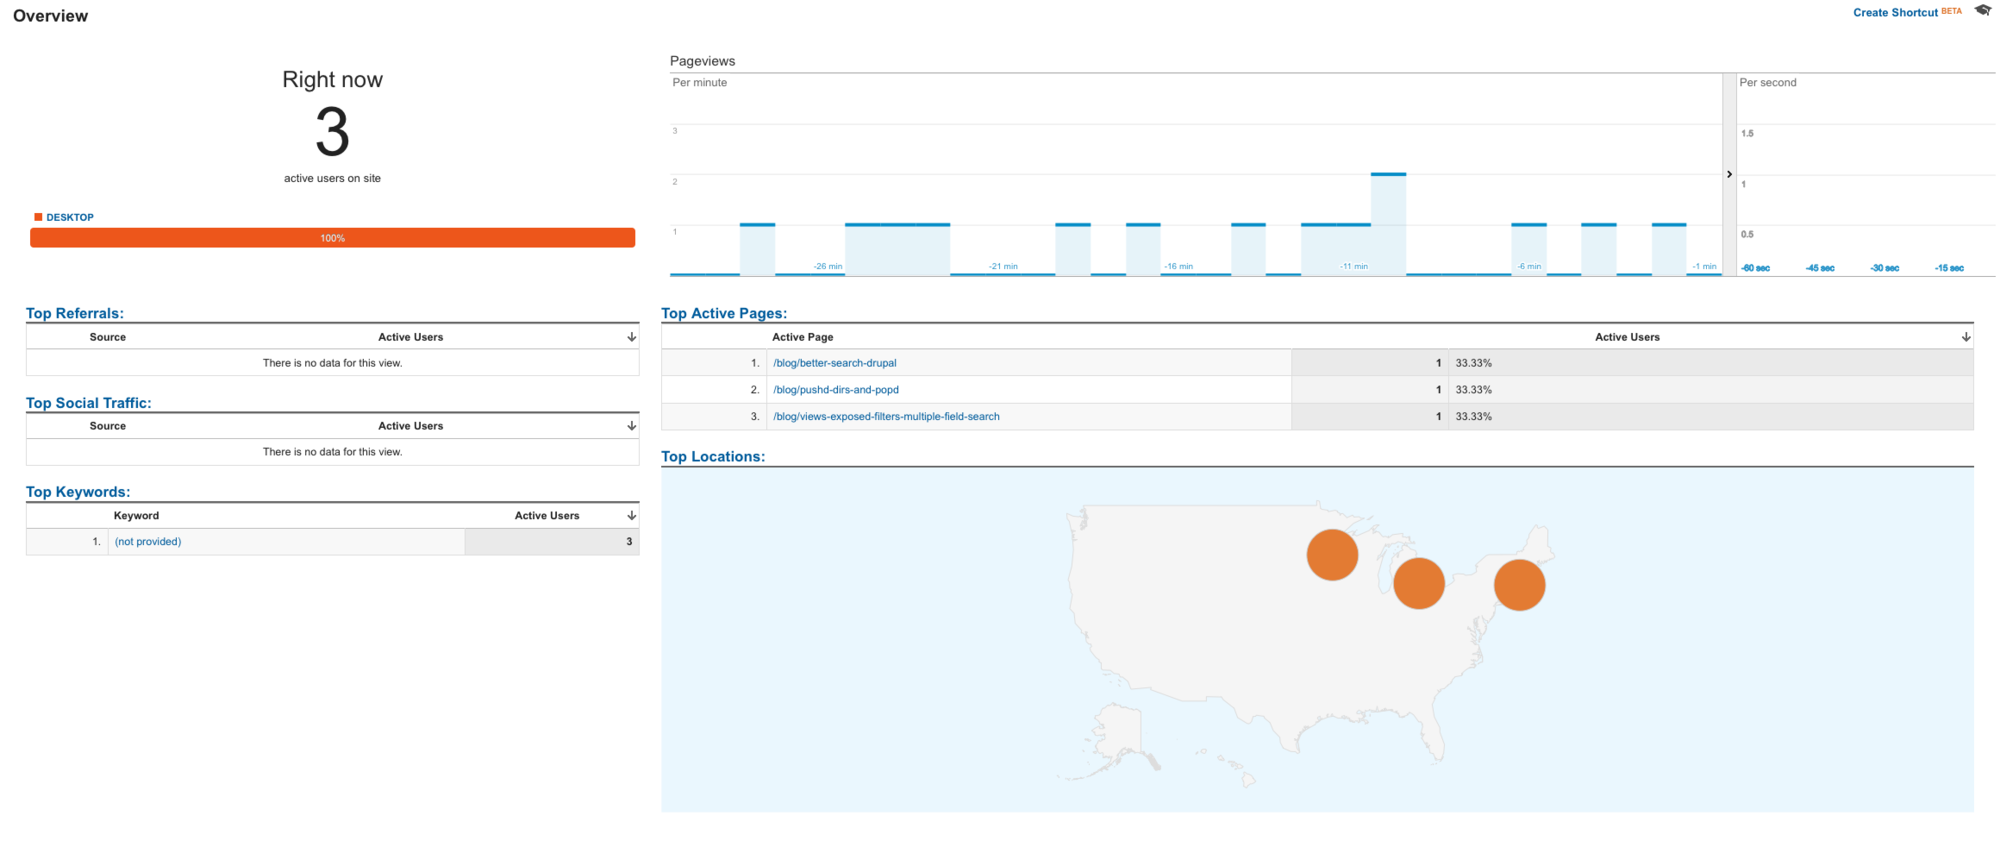
Real-time analytics allows you to monitor activity as it's happening on your site. You can see how many people are on your site right now, the top keywords being searched, top active pages, as well as the location(s) of those accessing your site.
How to access the report
- Log in to your Google Analytics account.
- Click the Reporting tab (if you have more than one site linked with your account, be sure that you’ve selected the site you want to view reports for).
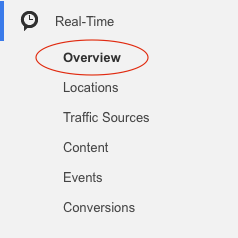
- Click Overview from the Real-Time menu item on the left-hand side of the page.
The "In-Page Analytics" report
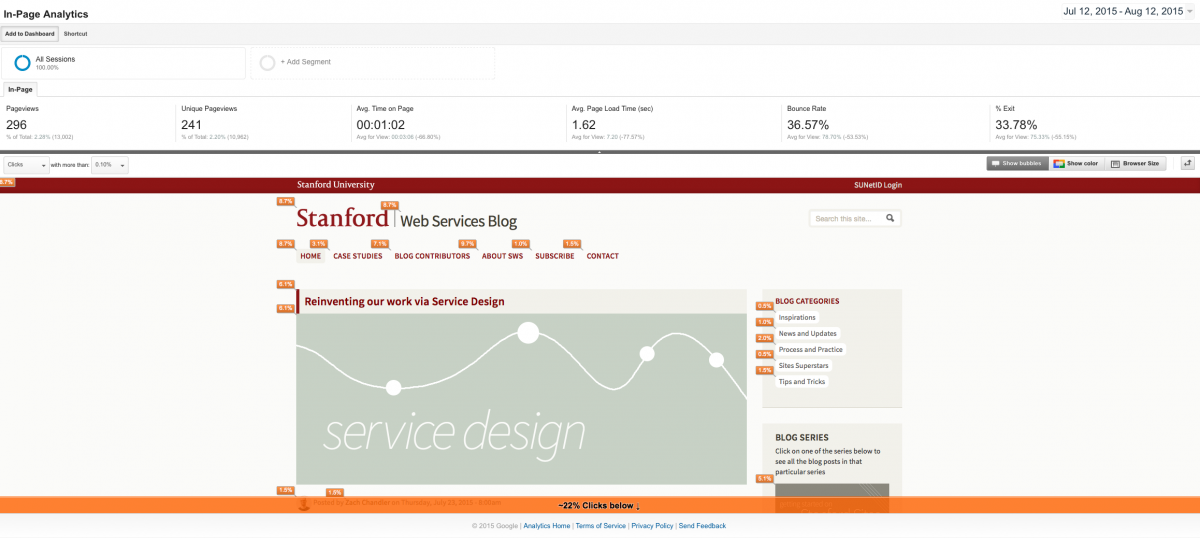
With the in-page analytics report, you can view extremely specific data on what links your site visitors are clicking on when browsing. The report provides an image of a given page with a visual overlay of where users are clicking. By understanding how visitors interact with your site, you can optimize your site layout to improve the user experience.
How to access the report
- Log in to your Google Analytics account.
- Click the Reporting tab (if you have more than one site linked with your account, be sure that you’ve selected the site you want to view reports for).
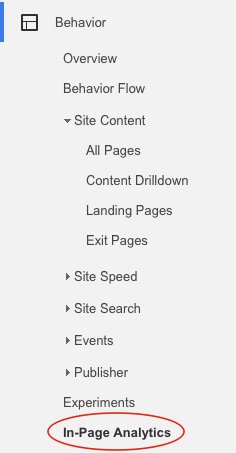
- Click In-Page Analytics from the Behavior menu item on the left-hand side of the page.
More in-page analytics coolness
There’s a cool and useful browser extension, Page Analytics (by Google), that allows you to view much of what the in-page analytics report shows you directly on your site.